In the plot, this simply moves the origin of the coordinate-system to the «center of gravity» of the dataset. In the figure below, the new coordinate-axis are drawn with black lines. You can see that the vertical line is at x=2.00, and the horizontal line is at y=2.98.
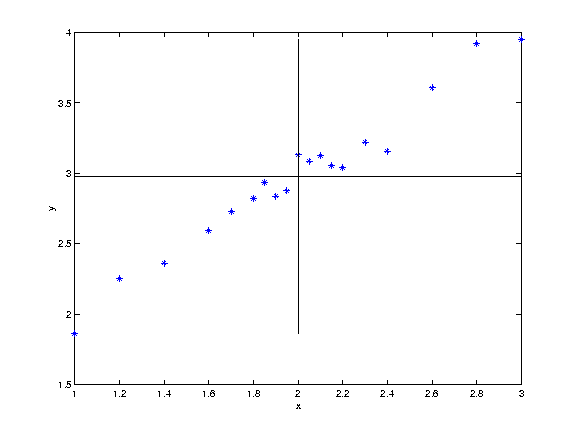
If you were to draw a straight line through all these datapoints, you would probably agree that the line should pass through the origin of the new coordinate-axis (the «center of gravity»). Having that settled, all we have to determine is the slope of the line.

